← All selected work

Marine data science · Supervised learning

Predicting significant wave height from environmental conditions

Built a reproducible preprocessing and model-selection pipeline to predict significant wave height from environmental conditions.

Completed course project · Imperial College London2024
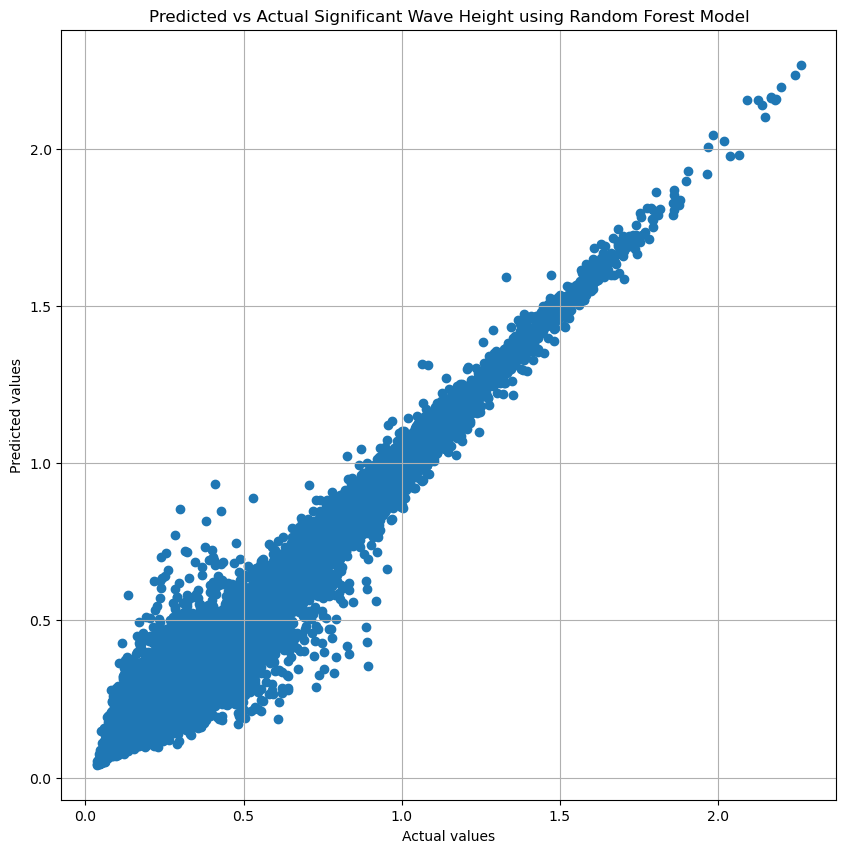
Predicted versus observed significant wave height
Random-forest predictions against observed significant wave height on the held-out test subset.
68,751observations
3model families
5-foldcross-validation
0.967test R²

01 / Question

Why this problem mattered

Significant wave height is a practical summary of sea state used in marine safety and operational planning. The project treated it as a supervised-regression problem and tested whether environmental conditions—including wind, direction, temperature and season—could support accurate predictions in a reusable modelling pipeline.

02 / Approach

From physical fields to usable evidence

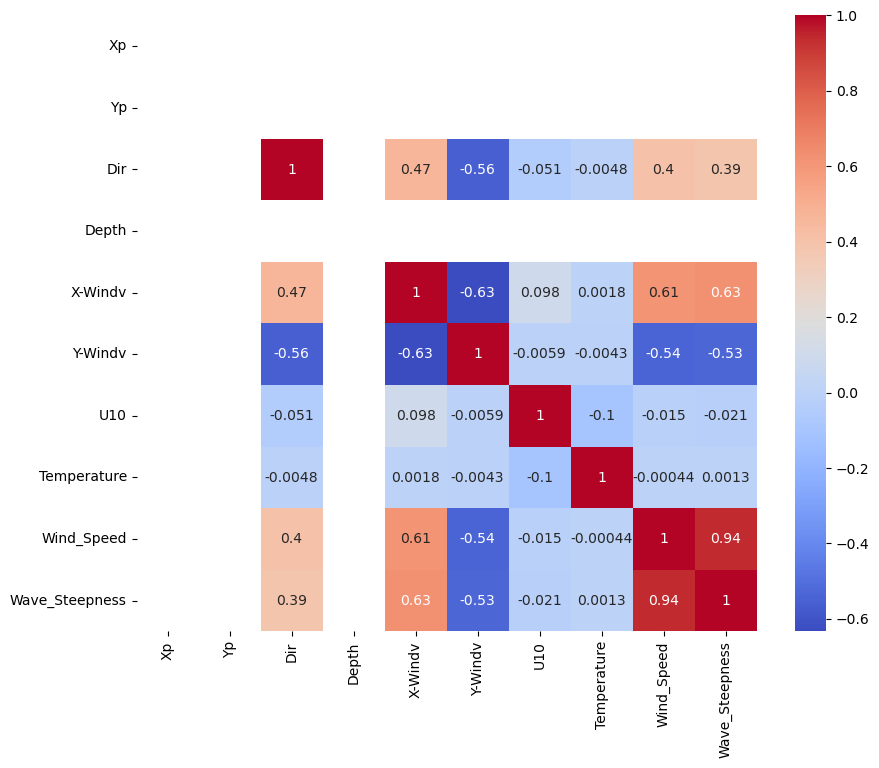
  1. Removed duplicate observations, created a reproducible 70/30 train–test split and used exploratory analysis to identify constant, highly incomplete and strongly correlated variables.
  2. Built a ColumnTransformer pipeline with median imputation and scaling for numerical features, one-hot encoding for categorical features and a spline transformation for wave direction.
  3. Compared linear regression with tuned random-forest and XGBoost regressors using five-fold cross-validation, R² and mean-squared error.

03 / Result

The tuned random forest provided the strongest held-out result.

The final random-forest model achieved test R² = 0.96678 and MSE = 0.003821, equivalent to an RMSE of approximately 0.062 m. XGBoost was close at R² = 0.96524, while the linear baseline reached R² = 0.88183.

Correlation heatmap for environmental wave-height predictors
Training-set feature correlations used to guide collinearity checks and feature selection.
Random-forest predictions compared with observed wave heights
Predicted versus observed significant wave height for the selected random-forest model.

04

Implications

The improvement over linear regression indicates that nonlinear interactions between wind, direction, temperature and seasonal conditions were important within this dataset. The study demonstrates disciplined preprocessing, cross-validated model comparison and clear selection of a final operationally interpretable metric set.

05

Limitations

The notebook uses a random train–test split. If the observations are temporally autocorrelated, that can overstate performance on genuinely future conditions. A stronger follow-up would use blocked temporal validation, encode direction explicitly as sine and cosine, report MAE and residual diagnostics, and evaluate rare high-wave cases separately.