04
Implications
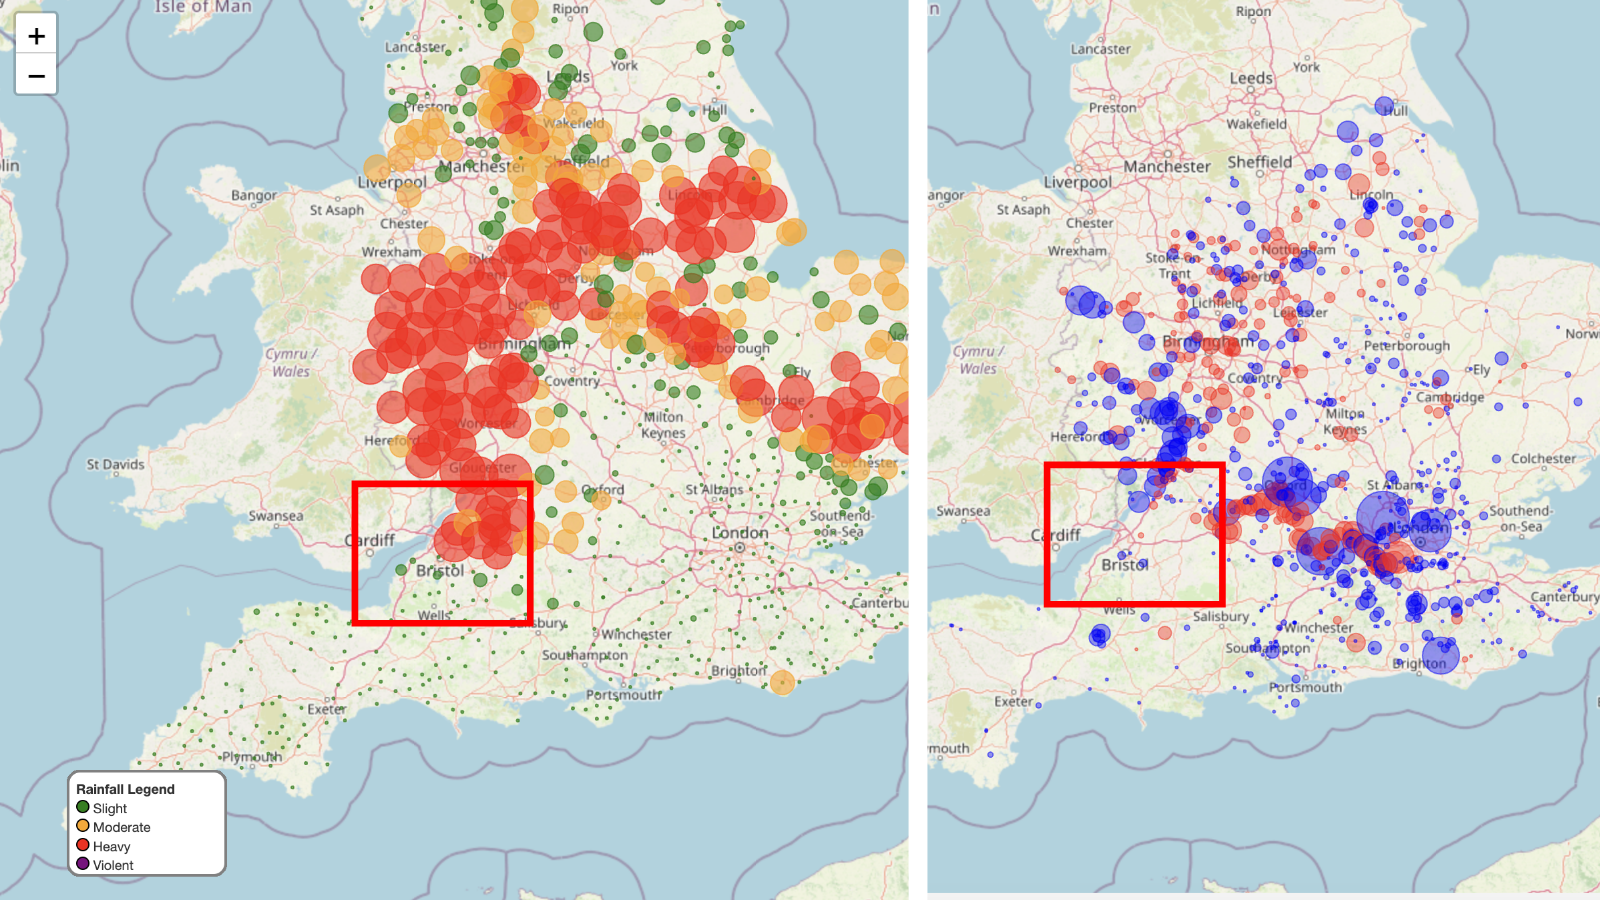
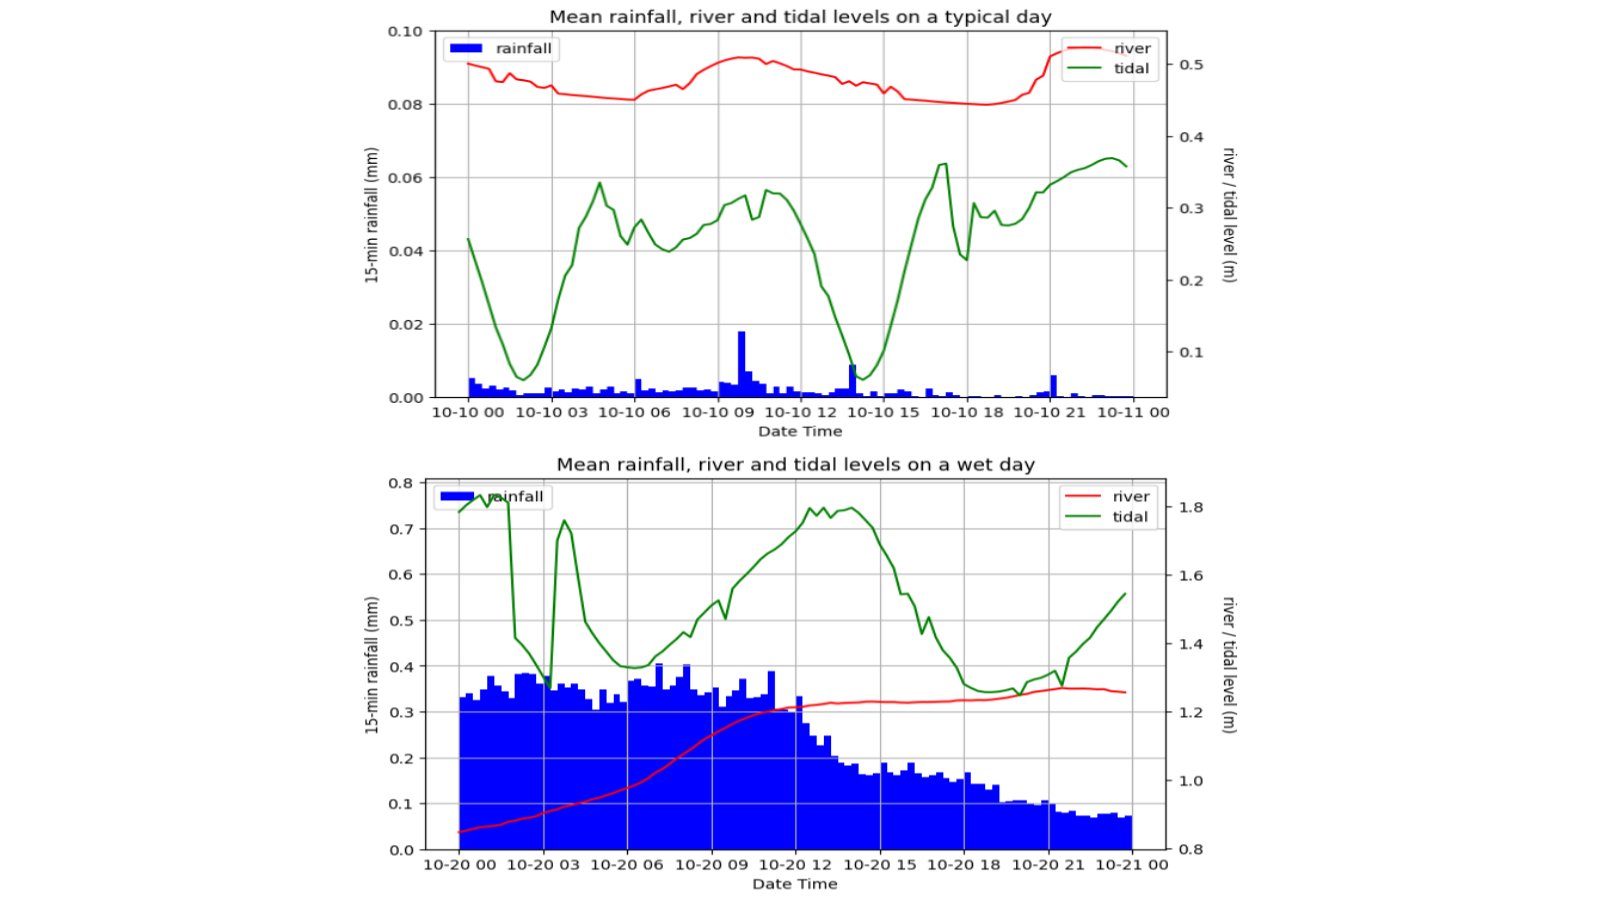
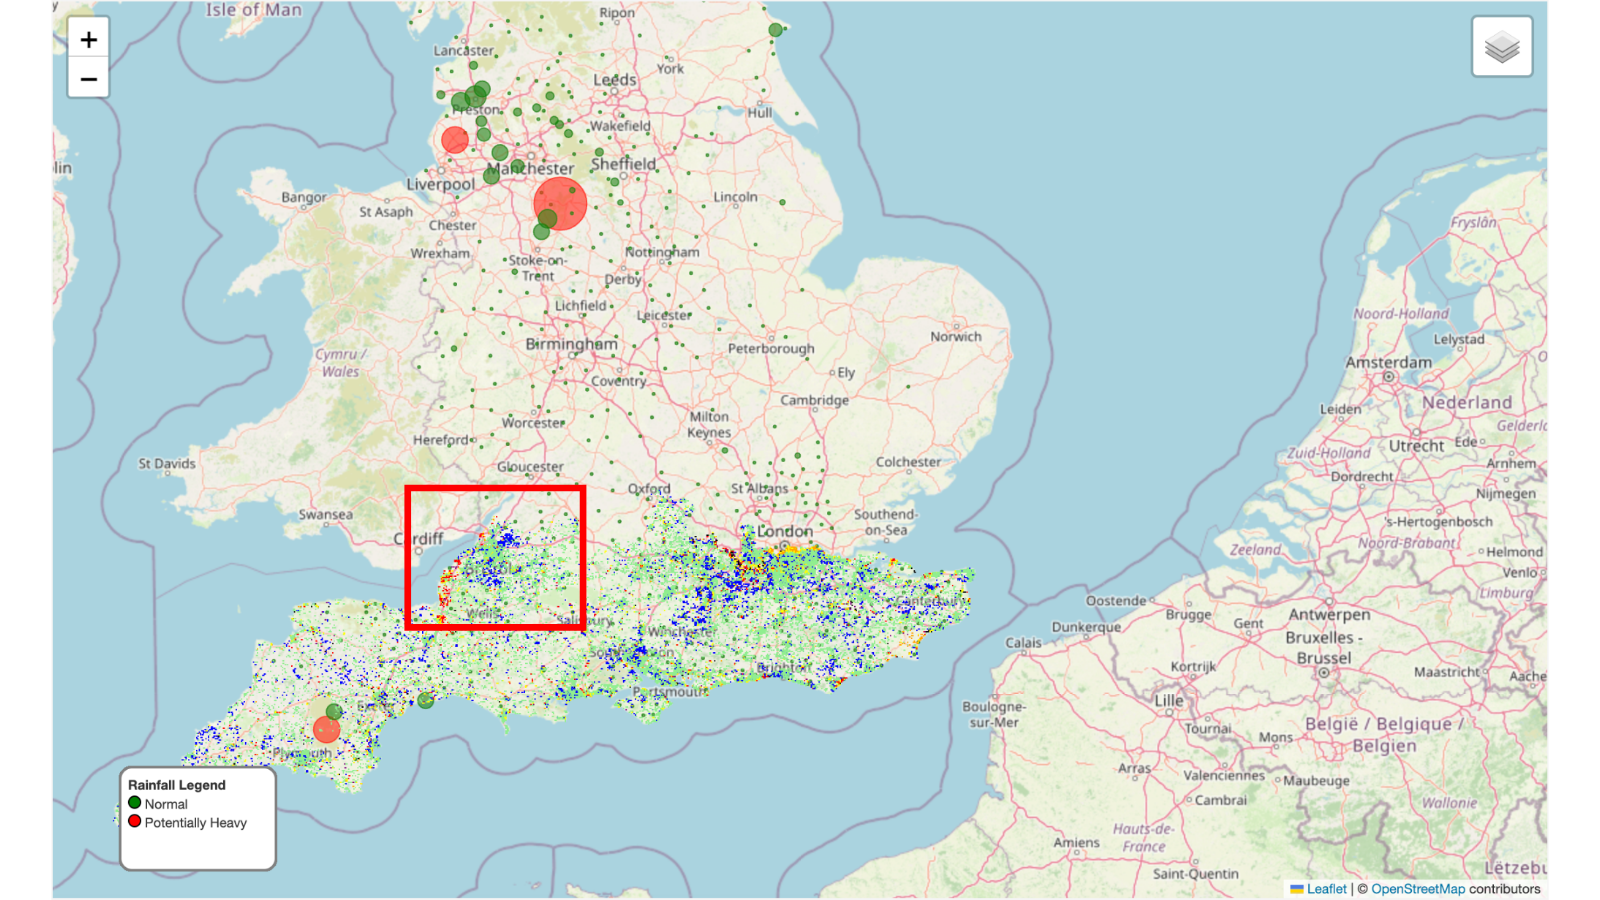
The work is strongest as an environmental-data visualisation case study. It shows how meteorological and hydrological observations can be organised around an applied risk question, and how maps and linked time series can communicate spatial and temporal patterns more effectively than disconnected tables or model outputs.